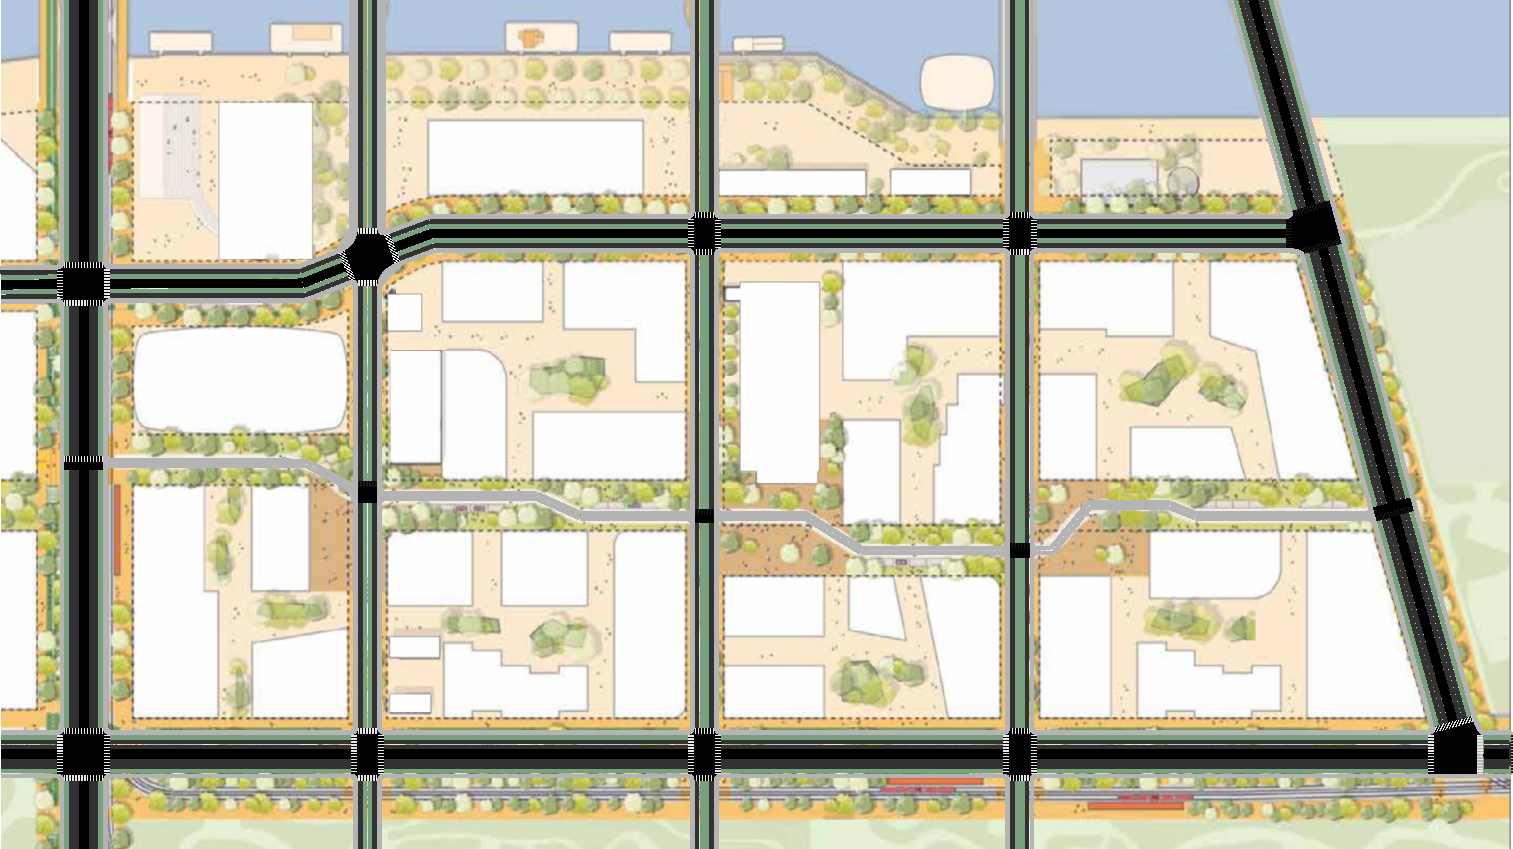
↑ Our proposed street network includes Boulevards (above) that allow all types of traffic but still set aside dedicated space for people using transit, cycling, and walking. (Sidewalk Labs)

Update from SideWalk Labs


by Willa Ng – 9 September 2019
We ran traffic simulations on our people-first street designs. Here’s what we found
By making it easier and safer to walk, bike, and ride transit, street flow improves for everyone — even drivers.
This post was co-written with mobility team associate Joyce Xu .
Earlier this year, we released a set of street design principles that we think can help cities create safer, more vibrant streets while still helping people get where they need to go. But principles don’t always work out as intended, and traffic dynamics are especially complicated. That’s why, when Departments of Transportation consider major changes to their streets, they typically first run a traffic simulation to help validate or adjust their assumptions.
We wanted to put our street designs through the same wringer. So we prototyped a road network in microsimulation with an open-source program called SUMO — short for “Simulation of Urban Mobility.” SUMO is similar to the simulations a city DOT might run, in that it models traffic demand through a road network, but it can also be adjusted to allow for non-vehicle modes (such as transit, bikes, and pedestrians) and new street designs.
To evaluate our principles, we built a simulation of a traffic network for a dense urban center, roughly one-fifth of a square mile.
We first simulated “business-as-usual” streets by incorporating typical road designs found today: the majority of space is dedicated to cars, transit vehicles and bikes share car lanes, and limited space is carved out for sidewalks. These roadways permit maximum speeds of 40 miles per hour. We’ve assumed that 70 percent of travelers drive on this network — a conservative estimate given downtown commute averages in the U.S.

We then built another version for our proposed street designs. This network reflects the fundamentals of our four principles:
First, we tailored the streets to prioritize different modes. Boulevards (for all traffic) and Transitways (prioritizing transit) run along the perimeter, facilitating longer trips. Meanwhile, smaller Accessways (cycling priority) and Laneways (walking priority) create a pedestrian and bike core, enabling people to navigate the neighborhood while partaking in its street life.
Second, we separated the streets by speed. Small changes in speed have big impacts on fatality rates: a person is 70 percent more likely to be killed by a car moving at 30 mph versus 25 mph. Our network slowed average speeds to just about 18 mph — down from the business-as-usual average of 30.5 mph — keeping speeds even lower on streets designed for pedestrians (max 4 mph) and cyclists (max 14 mph) to further improve safety.
Third, our streets are designed for flexible uses. In this particular network, the Accessways can benefit greatly from the concept of the “dynamic curb.” During peak travel hours, dynamic curbs can be used for passenger pick-ups and drop-offs or bypass lanes; during down times, they can be used for expanded sidewalk space, public gatherings, or pop-up stands.
Finally, our network recaptures space for the public realm and public transit. We allocated as much street space as possible to transit, bikes, and pedestrians — dedicating just 33 percent of road area to cars (with no on-street parking), compared to 76 percent in a business-as-usual version.
We believe this network’s improved transit, bike, and pedestrian options will encourage more people to leave their car behind. (So too would our preference to implement curb pricing, although the simulation doesn’t assume the immediate adoption of this policy.) For these reasons, our simulation assumes that only 40 percent of travelers use a car.
What We Found
Though this work remains in its exploratory phases, our initial simulations produced some promising results. Compared to a typical scenario, our proposed people-first streets fared better in several key areas:
- Both street types supported similar levels of “person throughput” — a measure referring to the total number of people using a street network — showing that people can still get around well-designed neighborhoods, even in cars, when vehicle lanes are removed.
- All travelers in our streets experienced less traffic congestion and a lower chance of gridlock at all levels of trip demand, largely as a result of people choosing alternative modes, such as transit or cycling.
- Our streets had lower average speeds, suggesting improved safety that can help cities reach their goals of Vision Zero street fatalities, but still had shorter trips during rush-hour conditions, thanks to steadier overall flow.
- Our streets reclaimed significant space for pedestrians and public realm — again, making it possible for a neighborhood to have livelier streets that support small businesses and retail services without making it harder for people to where they’re trying to go.
Let’s take a closer look at some key takeaways.
1. A network that prioritizes streets by mode and speed is far more resilient to congestion and gridlock.
The simulations found that, under normal traffic conditions handing about 4,500 travelers, both street networks fared comparably well. Travelers in our network spent about 25 percent of their trip waiting in traffic, versus 30 percent in the typical one, although trips were slightly shorter in the typical network thanks to faster speeds.
But under heavy traffic — handling 9,000 travelers — the typical network goes into gridlock, whereas our proposed network continues operating well, with less of a trip spent waiting in traffic (31 percent vs. 40 percent) and a shorter average trip duration (3.8 minutes vs. 4.3 minutes).

As you watch the simulations, you start to see why that’s the case. Rather than moving most traffic via cars — the least efficient form of transportation, from a space perspective — our network accommodates people using many modes. Cyclists use the protected bike lanes on Boulevards and Transitways, but also flock to Accessways. Pedestrians cut through the Laneway. And more people ride buses and trams, because the dedicated lanes lead to faster service.
Perhaps counter-intuitively, the driver experience also improves. Our street network reduces many of the frictions that can lead to delays, such as left and right turns (since cars stick to the faster perimeter streets), and even the number of times cars have to stop at intersections. The result is a more reliable trip at a consistent speed that avoids stop-and-go frustration.
2. Dedicated transit lanes are a simple but powerful tool to move people.
In contrast to cars, transit vehicles are the most efficient way to move people through dense urban areas. The problem is, in a typical street design, these vehicles have to share street space with cars, leading to delays and frustration that can push people toward driving.
In our street networks, buses and trams use dedicated lanes on both Boulevards and Transitways, enabling them to keep up a reliable pace and thus compete more effectively with driving. As you can see below, transit vehicles in the typical scenario get caught in light after light. But with a dedicated lane, they zip through whole streets in much less time.


In the rush-hour scenario, transit vehicles were only stuck in traffic for 32 percent of a trip, whereas they’re stuck for 43 percent in the typical network.
(It’s also worth noting that such a trip would be even faster with traffic signals capable of prioritizing transit, which we propose for our street network but can’t yet be incorporated into the model.)
3. Laneways create more vibrant street life, and can drive value for ground-floor retailers.
A third insight is just how much more welcoming our network is for pedestrians and cyclists, compared with a more traditional street network. As you can see from some of the gifs and screenshots, our network of Laneways attract much more foot traffic than a comparable traditional street. When you provide safe, pleasant sidewalks and pedestrian streets, people use them.
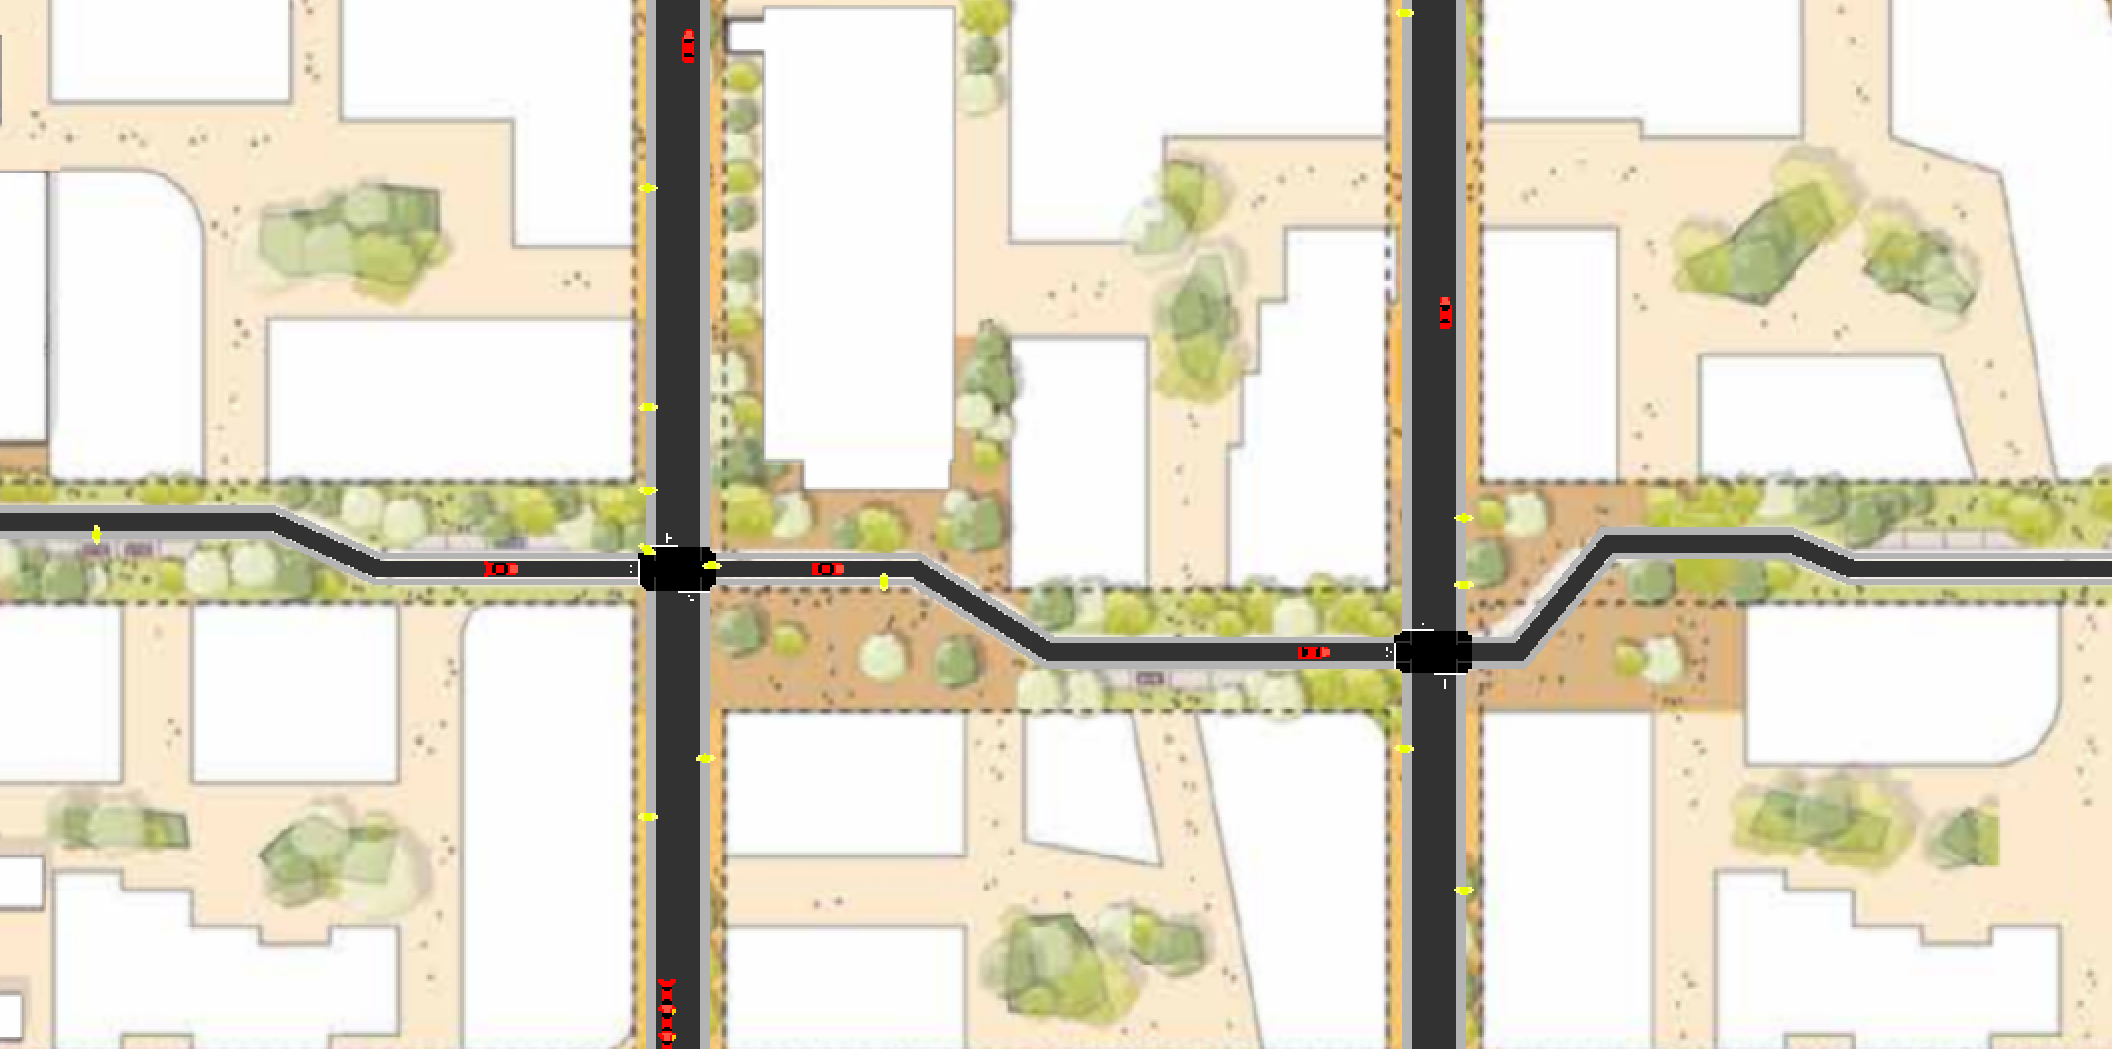

Our Laneways essentially create “superblocks” of pedestrian space — places where people can gather, shop, hold community events, and just linger without fear of speeding traffic. While cars are allowed on Laneways, they must travel at 4 mph; as a result, our model expects fast-moving cars to avoid these streets. Combine that with bike-friendly Accessways, and you get a powerful network designed for active transportation.
We’ve also created pedestrian-only “pedways” — areas in beige in the simulation — with no vehicle access. While these areas aren’t factored into the traffic simulation, we expect people to use them both for trip purposes and in other ways that bring local streets to life.
And it’s worth noting that our streets are designed to meet or exceed accessibility requirements, creating a safe environment for everyone.
Planning for the future
We’re encouraged by these early results. Of course, while simulations are a helpful mobility tool, they have limitations of their own.
For example, there are many aspects of our proposed mobility vision that are challenging to model, such as the price of curb space or the amount of time a dynamic curb is being used for public space (currently the model assumes it’s used by vehicles). We think those aspects will only make the network perform even better than a typical street grid, but those assumptions still need to be explored further through pilot testing.
Additionally, a simulation can only be as good as the data that feeds it, and thus is limited by the accuracy and resolution of observed data and trip forecasts. To that end, we’ve started to think about ways we can help make mobility simulations even stronger (more on that in a future post).
We believe our street design principles can lead to safer streets with more public space, more affordable options, and more use of transit, cycling, and walking. But the biggest barrier to implementing these principles — or versions of them — is political feasibility, not technical feasibility. Our hope is that these types of simulations can provide a basis for city planners and communities to have informed discussions on mobility trade-offs, and ultimately decide on the streets that work best for them.
Follow Sidewalk Labs with our weekly newsletter or subscribe to our new podcast, “City of the Future.”
View original article at medium.com
Recent Comments