↑ Geoff Boeing

This visualisation method shows how different cities are in terms of their layout. It would be most interesting to see if there is any correspondence between these structures and the structure of the historic language spoken (in the Chomskian sense).
 by DAVID MONTGOMERY – 26 July
Visualizing the Hidden ‘Logic’ of Cities
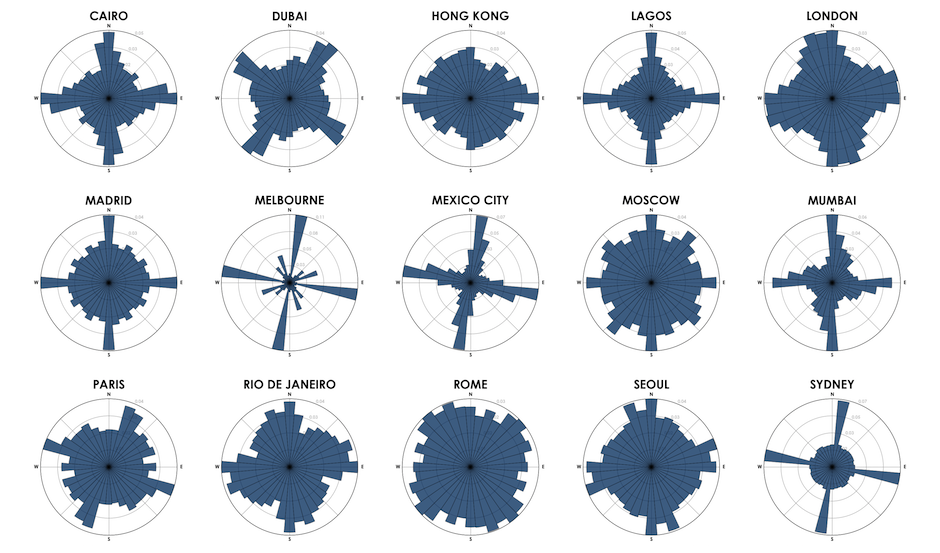
Some cities’ roads follow regimented grids. Others twist and turn. See it all on one chart.
Geoff Boeing calls this structure the “logic” of a city, and he would know: An urban planning scholar at the University of California, Berkeley, Boeing developed a tool to let anyone visualize this urban logic in seconds.
It works by using an old geography technique: the “polar” or circular chart. Boeing’s tool calculates what percentage of a city’s roads run along each section of a compass, and plots it on a circular bar chart. The island of Manhattan, for example, runs from south-southwest to north-northeast, and most of its streets are parallel or perpendicular to the island in a regular grid. Boeing’s program visualizes that as four long bars, with several shorter bars representing the borough’s minority of streets that don’t line up with the grid, as illustrated in the circular pattern below.


Visualizing city streets in a circular chart isn’t an original idea. Among others, data scientist Seth Kadish produced similar maps a few years ago. Where Boeing innovated is by releasing a free tool using the popular Python programming language to let anyone with just a little bit of programming skill create a similar map of any city.
“One of my main goals is to empower other people without a Ph.D. in city planning or a strong background in computer science to explore their own cities and discover their own patterns and relationships,” Boeing said.
In fact, now you don’t even need to know basic programming to visualize your city’s street layout like this. Another developer, Vladimir Agafonkin, was inspired by Boeing to create a fully interactive version that works in a browser window.

“Technologies have come such a long way!” said Agafonkin, a software engineer at Mapbox who created the popular Leaflet mapping software. “Today, a default browser on a mobile phone can crunch through data faster than a computing cluster a decade ago, and we have tools to do this in a few lines of code.”
View original article at www.citylab.com
Commentaires récents